Worked example
Warehouse Coverage Map by PIN Code
You plan the network, and the case for the next facility rests on coverage: which PIN codes the existing Gujarat operation already reaches the next day, and how much volume is riding on the ones it does not. You have the two numbers per code out of your own system, and the slide has so far been a table nobody reads past row six.
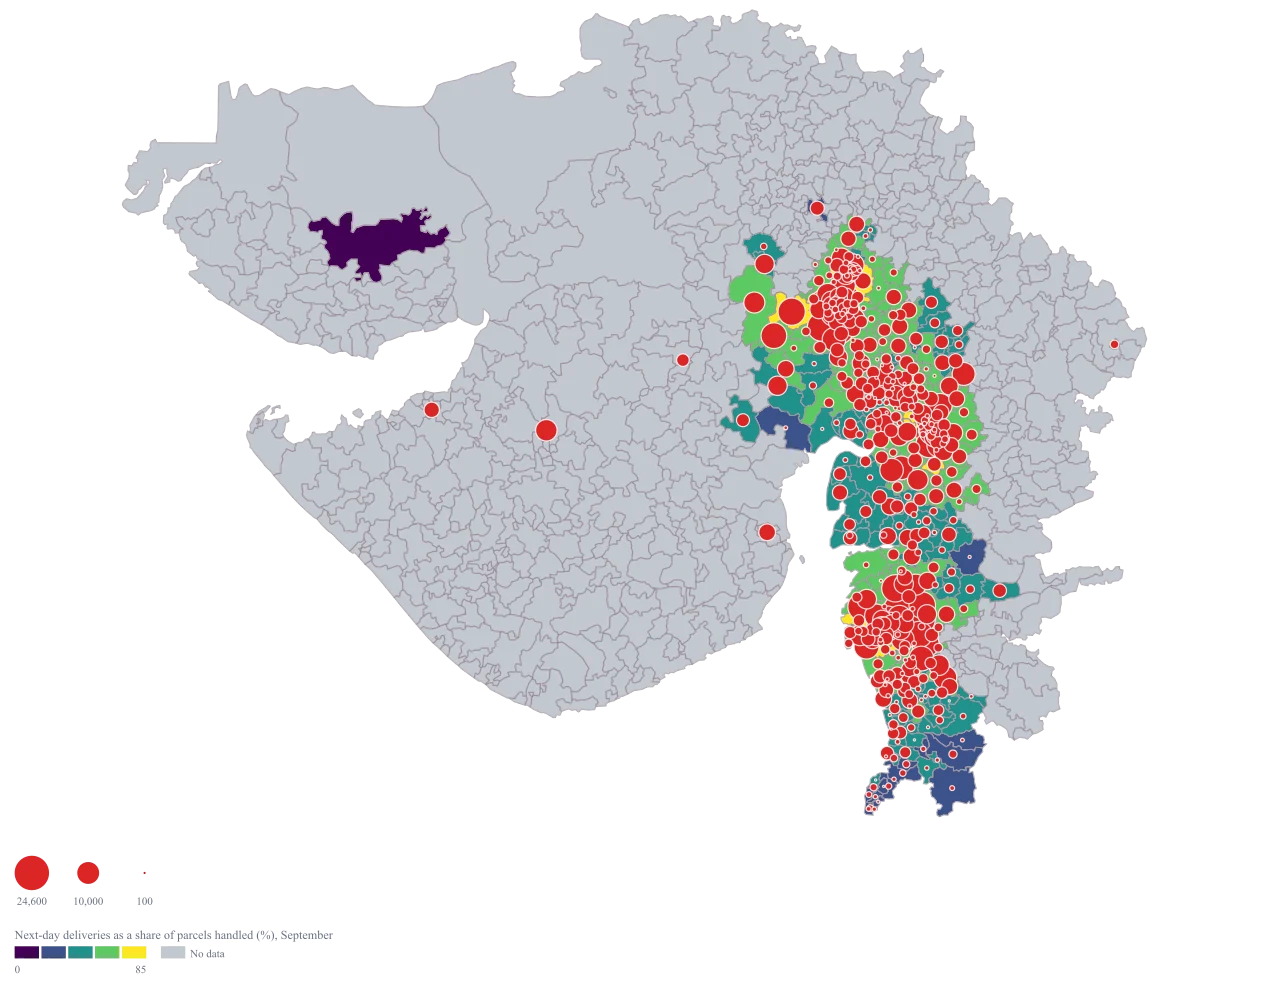
One Gujarat map on which a large bubble over a pale area is the case being made: real volume in a code the network is not reaching in time. The codes that are already fast stop being argued about, because the fill has settled them.
The four choices behind it
How this map was made
Four questions, in the order the builder asks them. Every picture below is the real renderer on the real geography, so this is the sequence you will see on your own screen.
- Step 1
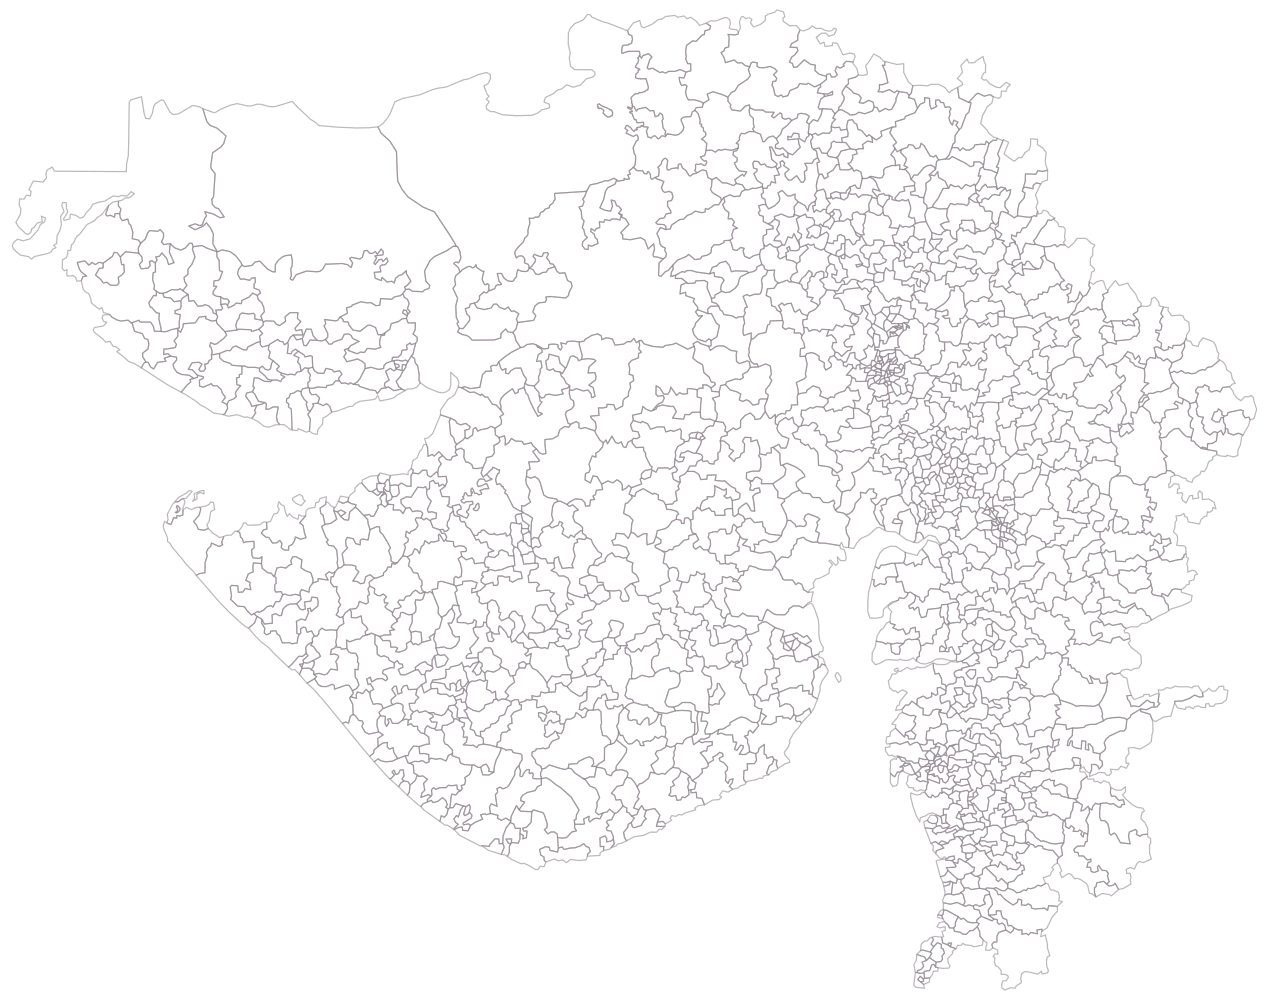
Choose Gujarat at PIN-code level rather than reaching for Pan India.
A thousand and twenty-five outlined areas, no colour, no legend — a dense mesh in the Ahmadabad and Surat corridors and open shapes across Kachchh and Amreli. It draws quickly and each code is large enough to be pointed at in a meeting, which the national version at 19,916 areas is not.
- Step 2
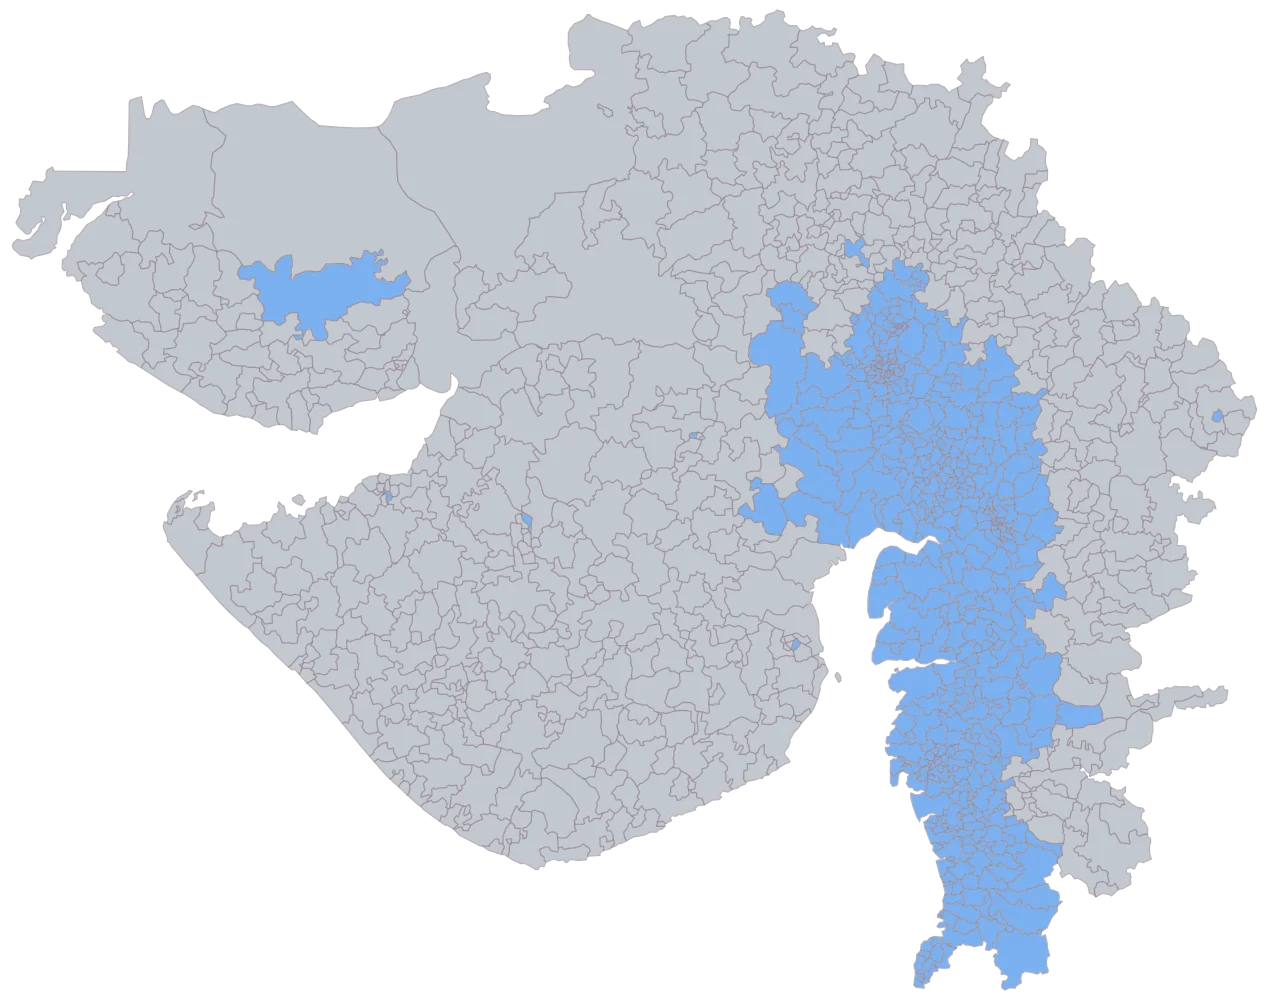
Paste the 463 rows with the PIN codes in the first column.
462 areas take a flat blue and 563 stay grey. The blue is one continuous corridor — Ahmadabad and Gandhinagar, down through Anand, Kheda, Vadodara and Bharuch into Surat, Navsari and Valsad — with seven single codes outside it at Rajkot, Jamnagar, Bhavnagar, Surendranagar, Mahesana, Dohad and Kachchh. That shape is the serviceable area, and it is exactly why the count matters: Saurashtra and the north are grey because nothing was claimed there, so a code inside the corridor that failed to match is grey for a completely different reason and looks identical. 365601 is the one intended blank.
- Step 3
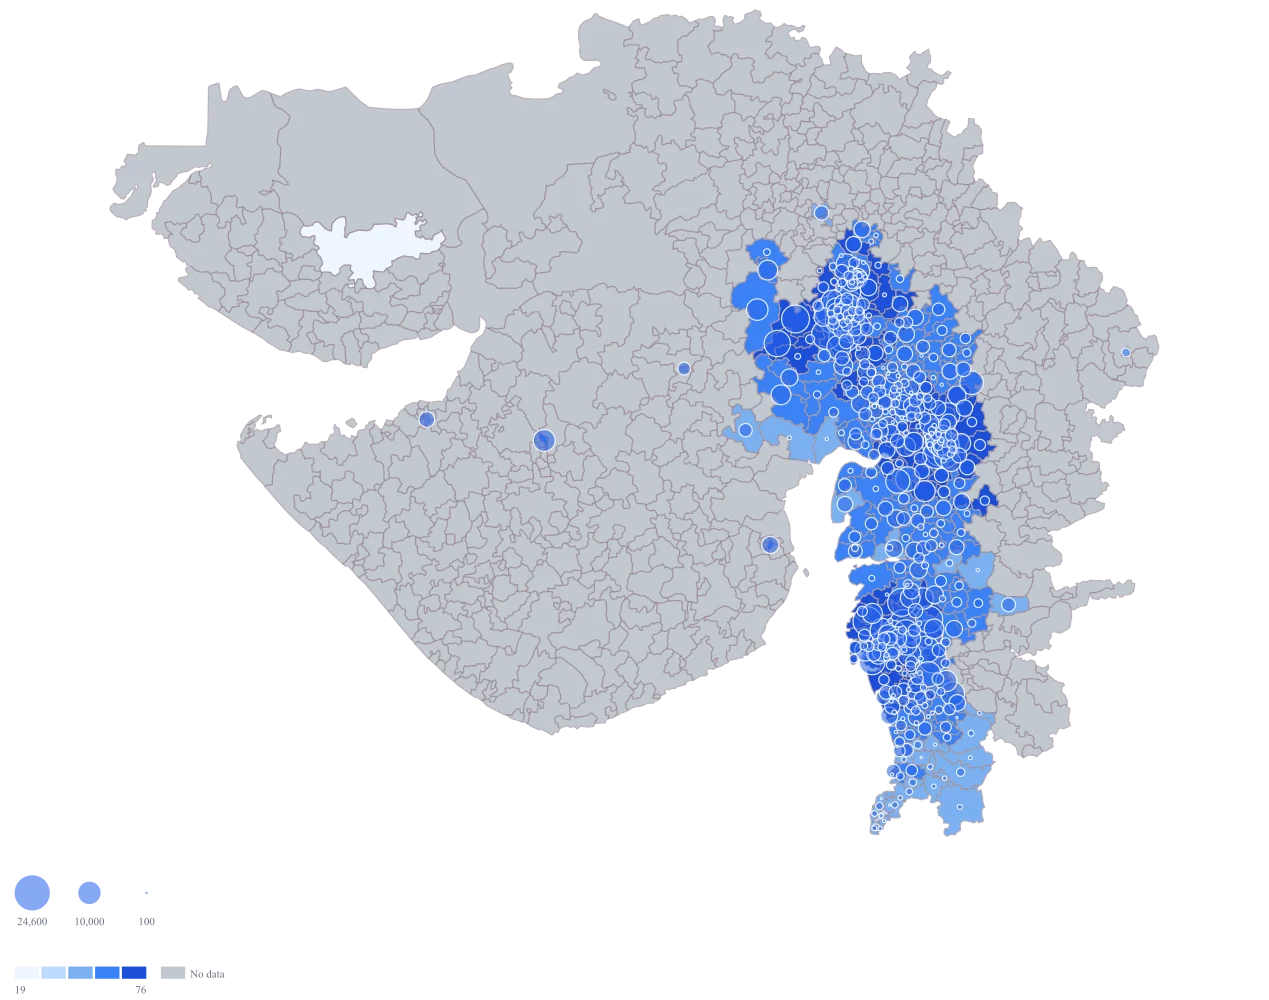
Turn both encodings on — bubbles sized by parcels, fill coloured by next-day share — with the default palette and scale.
The picture arrives: fat circles on dark fill through Ahmadabad, Vadodara and Surat, and the two readings coming apart towards the edges of the corridor, where the coverage drops into the fifties and forties under much smaller circles. The default scale reads this spread as unskewed and cuts even intervals, which sends 237 of the 462 codes into the top band and leaves the bottom two bands holding four codes between them — so the corridor comes out almost uniformly dark and the frontier at its edge, which is the whole subject of the review, is the thing you cannot see. 370001 shades at the bottom of the ramp with no circle on it, and next to 365601's grey the difference between a measured zero and no measurement is already hard to see. The default bubble is the same blue as the fill, so the circles over the darkest codes are losing their edges.
- Step 4
Move the fill to the viridis ramp, set breaks of your own at 0, 50, 70 and 85, give the bubbles a red, and write the legend title out in full.
This is the fix for the zero, and it needs both halves. The break at exactly 0 gives 370001 a band whose legend entry says zero rather than "0 to 19", and viridis is the one ramp here whose lowest step is a dark colour rather than near-white, so a measured zero can no longer be mistaken for the grey of 365601 at a glance. The upper breaks are round service levels rather than cuts taken from this month's spread, and they open the corridor up instead of flattening it: 23 codes below half, 107 between 50 and 70 per cent, 224 between 70 and 85, and 107 above 85. The middle two bands are the coverage frontier the case rests on. Red bubbles stay visible across the whole ramp, from the dark bottom to the yellow top, and the legend title carries the measure, the unit, the denominator and the month — which, with no labels on the map, is the only place any of that can live.
The sheet
Paste these columns straight from Excel. The first column names the place; the rest are numbers. Nothing is uploaded — your sheet is read in the browser.
| PIN code | Parcels handled in September | Next-day share of parcels (%) |
|---|---|---|
| 380015 | 24600 | 92 |
| 380001 | 21300 | 89 |
| 382210 | 17800 | 84 |
| 390001 | 15400 | 81 |
| 395003 | 14100 | 78 |
| 360001 | 9600 | 71 |
| 388001 | 7200 | 66 |
| 364001 | 5800 | 58 |
| 361001 | 4900 | 54 |
| 384001 | 4100 | 49 |
| 363001 | 3300 | 41 |
| 396001 | 2700 | 37 |
| 389151 | 1500 | 22 |
| 370001 | 0 | 0 |
| 365601 | — | — |
| 380014 | 20400 | 92 |
The first 16 rows of 463. The map above is drawn from all of them — a national map wants a national sheet, and yours will be longer than this too.
Why this map
Coverage and volume are two different numbers about the same code, and the decision lives in the combination, so both belong in one shape: the bubble carries the parcels, which can be added, and the fill carries the next-day share, which is a percentage and cannot. The Ahmadabad codes hold 459,300 of the 1,901,400 parcels on the sheet, close to a quarter of the whole operation in one district, and 389151 in Dohad sits at the far end with 22 per cent next-day on 1,500 parcels. Nothing on this map plots a facility: there are no pins and no latitude and longitude, so it shows which codes are covered, not where to put the shed that covers them. The figures are illustrative and are not any real operation's.
What goes wrong
The instinct at PIN level is to map the whole country at once, and the cost is real on both ends. The Gujarat file carries 1,025 areas at about 316 KB; the Pan India PIN geometry carries 19,916 areas at about 6.7 MB — roughly twenty times the areas and twenty times the weight — and at that count a single code is a few pixels on a screen and sub-pixel in print. A national PIN map is slow to draw, heavy to embed and, for anything smaller than a whole region, unreadable.
Map the slice the decision covers. If the review is about the Gujarat operation, the Gujarat geometry is both lighter and more legible, and the codes are large enough on the page to be pointed at. Keep Pan India for the case where the finding genuinely is national — a coverage frontier that crosses state lines — and even then expect to pair it with a per-state map that people can actually read, rather than asking the national one to do both jobs.
A zero and an absence look identical to a reader and mean opposite things. 370001 in Kachchh is a genuine zero on both columns — a code the network serves on paper where nothing moved last month, which is a finding and probably the most interesting row on the sheet. 365601 in Amreli is blank because it is outside the plan entirely, which is not a finding at all. If the lowest step of the ramp is nearly white and no data is grey, those two sit side by side looking like the same kind of nothing.
Keep the lowest bucket unmistakably a colour: set your own breaks so zero occupies a band of its own, and choose a ramp whose lowest step is a colour rather than paper. Most sequential ramps begin at something close to white, which is the worst available place to put a real finding; viridis begins dark, and is colour-blind safe besides. Then say in the caption what grey means, because the map cannot — the no-data styles are grey, white, none and custom, and there is no hatching to fall back on. And check the zeroes are real before you publish one: a code that reads zero because a filter dropped it is the same picture as a code that genuinely stood still.
At PIN level with labels off, the legend title is the only text on the map, and if it is left as the column header it is not enough. "Next-day share" does not say a share of what, over what period, or whether the number is a count or a percentage; a reader who assumes it is parcels rather than per cent will read 92 as a very small code. The map then travels without its units, and the person quoting it three weeks later is quoting a number whose meaning they have reconstructed.
Write the legend title as a sentence fragment that would survive being read on its own: the measure, its unit, its denominator and its period. It costs one line and it is the only part of the map that can carry them. Do the same for the bubble legend where the map has one, because a map with two encodings has two units and a reader who has worked out one will assume the other.
Other worked examples
- PIN Code Map of Delhi — Delhi, pin code, bubble + colour
- Coverage vs Demand Map of India — Gujarat, district, bubble + colour
- District-Wise Sales Heat Map of India — Pan India, district, bubble + colour
- Health Facility Map of India by District — Tamil Nadu, district, bubble + colour