Worked example
Store Catchment Map by PIN Code
You look after customer analytics for a small chain of outlets in Karnataka. Every loyalty record carries a home PIN code, so you know exactly which codes the stores already draw from — and the question keeps being asked as "draw me the catchment", which is not the same question at all.
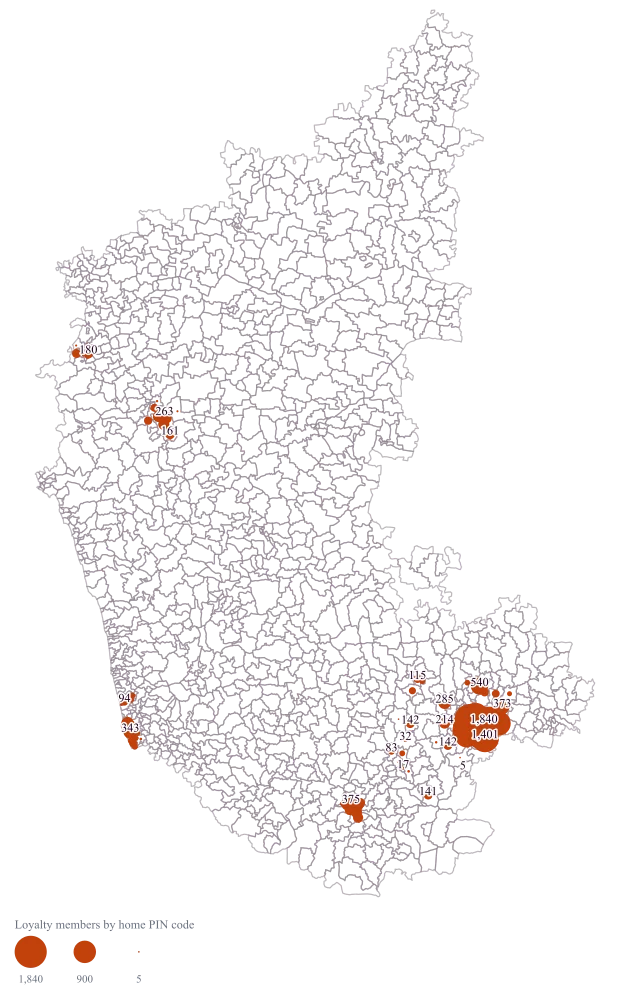
A Karnataka map with a bubble on every PIN code your members actually live in, sized by how many of them there are, so the shape of the existing draw is visible and the conversation moves from a drawn boundary to the codes you can name.
The four choices behind it
How this map was made
Four questions, in the order the builder asks them. Every picture below is the real renderer on the real geography, so this is the sequence you will see on your own screen.
- Step 1
Choose Karnataka and set the level to PIN code.
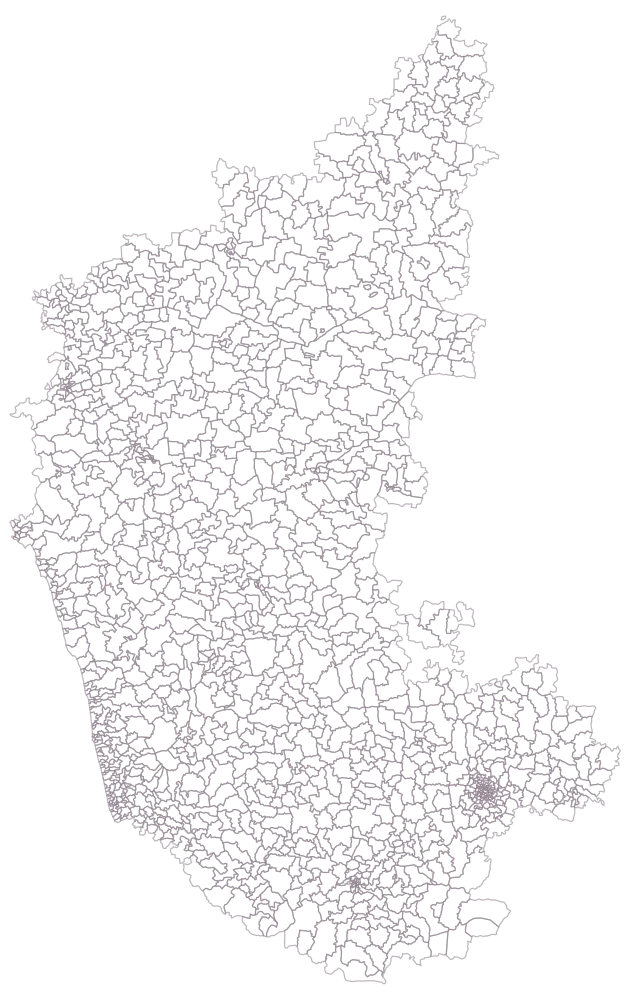
A mesh of 1,355 outlined areas, with no colour and no legend. Bengaluru is a dense knot of cells in the south-east and the rest of the state is comparatively open, which is the whole tension of this page in one picture: the codes that carry nearly all your members occupy almost none of the frame.
- Step 2
Paste the 161 rows, home PIN codes first.
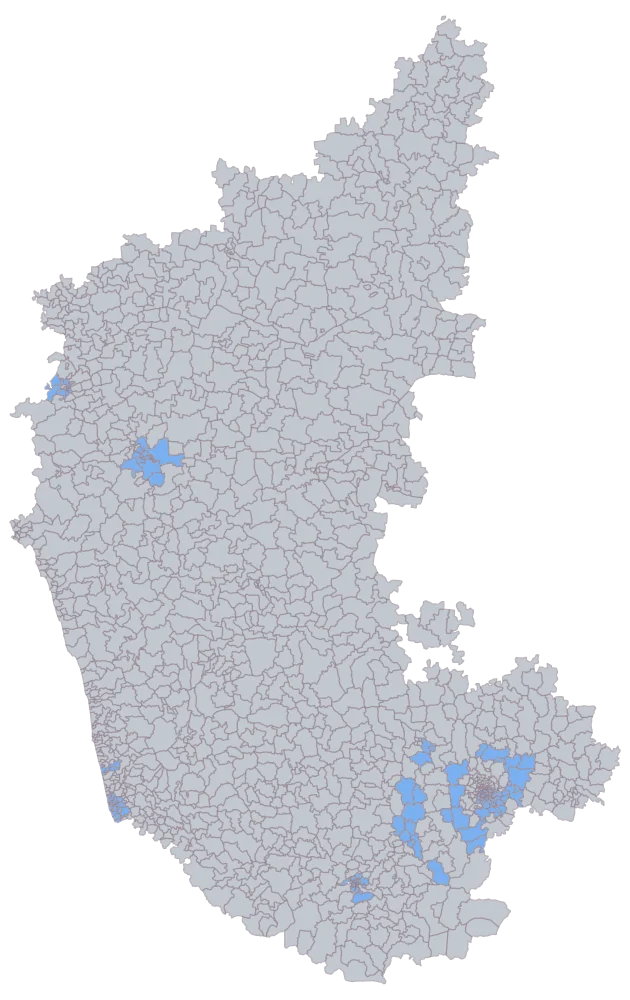
160 cells shade flat blue and 1,195 stay grey. The blue is not spread across Karnataka: it is a knot around Bengaluru with four smaller ones at Mysuru, Mangaluru, Hubballi-Dharwad and Belagavi, which is what a small chain's membership looks like when you stop drawing boundaries and just plot where the members are. At this density the join is the only opportunity to catch a code that did not match: a member count you thought was on the map and is not will not announce itself later. 590001 is the one deliberate blank; anything else unshaded inside those five clusters is a row to go back and fix.
- Step 3
Switch to bubbles sized by member count, with the defaults and the legend on.
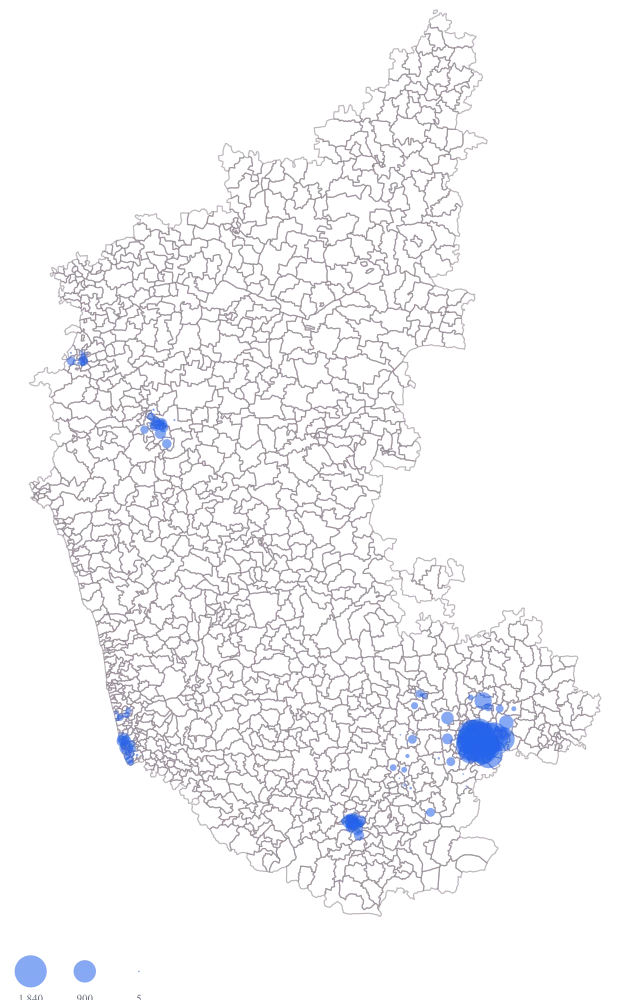
The state stays grey, because a bubble map colours nothing, and a circle appears at the centre of each of the 159 areas your sheet gave a count above nought. The Bengaluru codes immediately dominate — 560037 at 1,840 against 570001 at 132 in Mysore — and they also immediately collide: the city's fifty-odd codes sit inside about twenty pixels of a state-wide map, and the largest circle is more than twice that across, so the city reads as one mass rather than as fifty-odd separate readings. 580020 has no circle at all, because nought members draw nothing, and at a glance it is indistinguishable from the grey of 590001, which is blank. The bubble sits at the centre of the PIN area and marks nothing on the ground: it is not a store, not an address, and not a boundary anybody could walk.
- Step 4
Switch value labels on, give the bubbles a dark orange fill, and title the legend with what is being counted.
Only the areas carrying a value get a label, so the map places 160 numbers rather than 1,355 — the right way round at this density, and the reason area names stay off. The dark orange lifts the circles off the grey base so the small ones around Mysuru and Mangaluru are findable, and the zero at 580020 now reads as a zero rather than as an area nobody counted. The legend title says these are members by home PIN code, which stops the map being read as a map of stores. What none of it fixes is the city: inside Bengaluru the circles overlap and the labels collide and are dropped, so at state scale this map can honestly tell you that five-sixths of the membership sits in one place and no more than that. To read the city, map Bengaluru's codes as a sheet of their own, where they fill the frame and the circles have room, and keep a ranked list beside either map for the values themselves.
The sheet
Paste these columns straight from Excel. The first column names the place; the rest are numbers. Nothing is uploaded — your sheet is read in the browser.
| PIN code | Loyalty members with this home PIN | Members who bought in 90 days |
|---|---|---|
| 560037 | 1840 | 812 |
| 560066 | 1615 | 703 |
| 560103 | 1402 | 661 |
| 560076 | 1188 | 540 |
| 560034 | 1046 | 498 |
| 560078 | 934 | 405 |
| 560100 | 812 | 366 |
| 560008 | 605 | 271 |
| 560001 | 428 | 190 |
| 562130 | 214 | 88 |
| 570023 | 176 | 74 |
| 570001 | 132 | 55 |
| 575001 | 6 | 3 |
| 580020 | 0 | 0 |
| 590001 | — | — |
| 560111 | 1543 | 617 |
The first 16 rows of 161. The map above is drawn from all of them — a national map wants a national sheet, and yours will be longer than this too.
Why this map
This map does not compute a catchment and cannot: there is no address, no latitude and longitude, no drive-time and no boundary-drawing anywhere in the product. What it does is size a count you already hold against the PIN code it is recorded under, which is the honest version of the question — where do the members you have actually live. A bubble is right for it because member count is a count, and because PIN areas differ so much in physical size that filling them would let one large peri-urban code outshout nine dense city ones. The sixty-five codes in Bangalore and Bangalore Rural hold 42,716 of the 51,468 members on the sheet, about five in six. All figures are illustrative and describe no real chain.
What goes wrong
A PIN code in your table that the geometry does not carry disappears without a word. It happens more than people expect: a code that is a post box or a non-delivery office and has no area to draw, a code created after the source was compiled, a five-digit code that lost a character in an export, a code typed with a space in the middle. The Karnataka file carries 1,355 areas and the country as a whole has 19,916 in this geometry, so there is no shortage of codes that exist somewhere in your systems and not here.
Read the unmatched list first, before you look at the map at all. A map made from ninety per cent of your members is a perfectly attractive map and it is answering a different question from the one you asked. Count the rows you pasted against the areas that shaded, then work the difference: fix what is a typo, and for what is genuinely absent from the geometry, add the count to the caption as a stated figure rather than letting it vanish.
The moment you divide one of these columns by the other, the small codes take over. 575001 in Dakshina Kannada has six members, three of whom bought in the last ninety days, which is fifty per cent — the best active share on the sheet — while 560037, with 1,840 members and 812 active, reads about forty-four per cent. On a ramp those two sit in that order, and the map has no way to say that one of them rests on six people. 580020 is worse still: nought out of nought is not a low rate, it is not a rate at all.
Set a minimum base before you look at the results and blank every code below it, so a thin code is drawn as no data instead of colouring the map. Keep the raw counts beside the rate in the sheet so any code you are challenged on can be checked in one glance, and where a rate is the exhibit, say in the caption what the minimum base was. Codes with no members belong out of the rate map altogether, and on the count map where they are a genuine zero.
Labels are unusable at PIN density. Turning on area names asks the map to write a six-digit code into a cell a few pixels across, and because names are placed largest-first and anything that would collide is dropped, what comes out is a handful of codes scattered over the state with no relationship to which ones matter — the ones you most want named are the dense urban cells, and those are exactly the ones that lose the collision. The result is worse than no labels, because it looks deliberate.
Leave area names off and label the values instead: only the areas your sheet named carry a value, so a dozen numbers are placed rather than a thousand, and they land on the areas you are actually talking about. Identify the codes themselves in a ranked list beside the map, in the tooltip, or in the caption — text at reading size, next to the picture, does the job the map physically cannot do at this scale.
Other worked examples
- PIN Code Map of India for Customer Concentration — Maharashtra, pin code, bubble
- District-Wise Revenue Map of India — Pan India, district, bubble
- Tourism Footfall Map of Rajasthan by District — Rajasthan, district, bubble
- PIN Code Map of Delhi — Delhi, pin code, bubble + colour