Worked example
Parliamentary Constituency Map of West Bengal
You are the research assistant on an election studies project and the chapter needs its base map: the state's 42 seats, with the polling infrastructure figures the team has been collecting laid over them. The sheet came from four different revisions of the roll, the seat names in it were typed by four different people, and the supervisor's only instruction was that the map must not be wrong.
One map of West Bengal in which each seat carries how many polling stations were added at the last revision as a bubble and how crowded its stations already are as a fill — with every one of the 42 names resolving to the seat the geometry actually holds.
The four choices behind it
How this map was made
Four questions, in the order the builder asks them. Every picture below is the real renderer on the real geography, so this is the sequence you will see on your own screen.
- Step 1
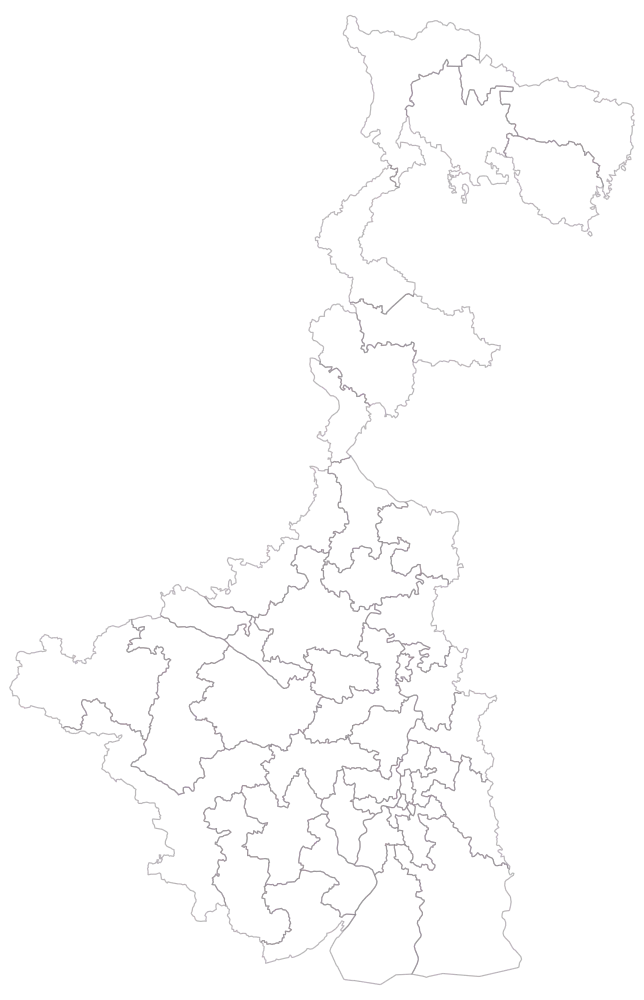
Choose the Parliamentary level and set the area to West Bengal, and compare the outline against a district map of the state before you go further.
The 42 seats are drawn empty — no fill, no bubbles, no legend. Put beside the state's districts, the seats in and around Kolkata are visibly smaller and the seats along the western and northern edges visibly larger, which is the equal-population rule showing up as geometry. Fix that picture in your head now; it is the thing every later reading of this map has to be corrected for.
- Step 2
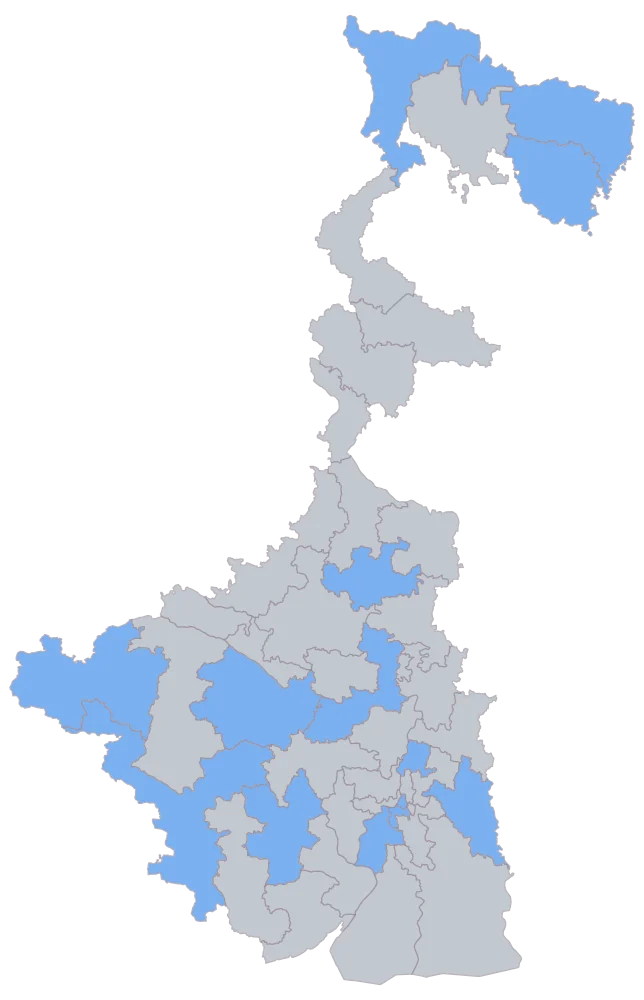
Paste the sheet and check every suffixed seat by eye in the match report before you accept it.
Fifteen seats shade in one flat blue and the other twenty-seven stay grey. This picture is the join and nothing else, and it is the cheapest possible check on the suffix problem: if Jhargram, Bishnupur, Coochbehar, Alipurduars or Bardhaman Purba is grey here, the name did not resolve, and no amount of work on the colours afterwards will bring it back.
- Step 3
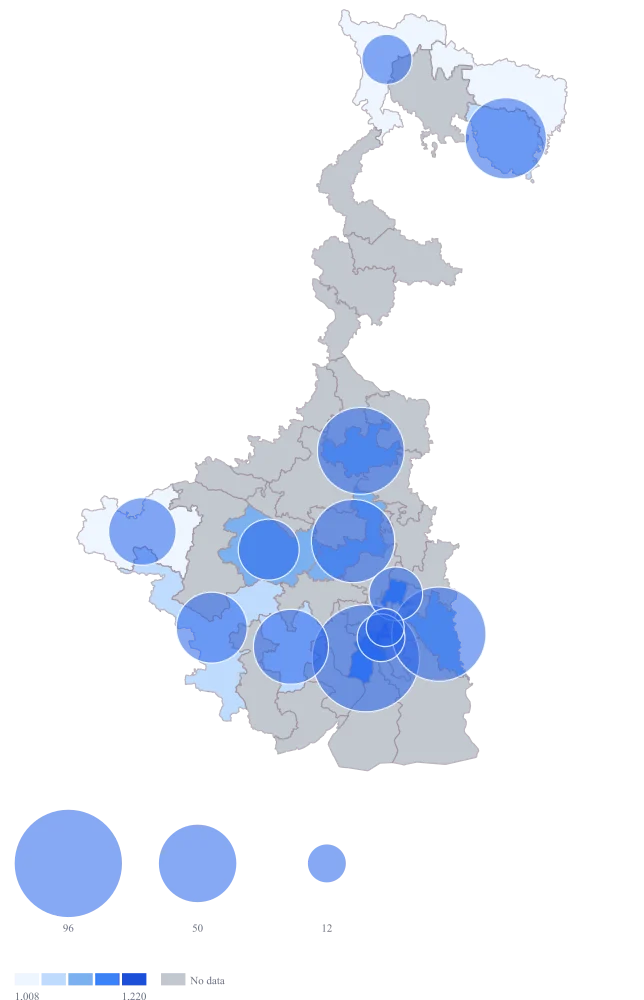
Send the added-stations column to bubble size and the electors-per-station column to the fill, and leave the defaults alone.
Circles appear over the shaded seats and the fill becomes a ramp with a legend. The problem is immediately visible: the default bubble and the default fill are the same blue, so Diamond Harbour's large circle and Kolkata Dakshin's dark fill are fighting each other, and Alipurduars — the seat that added nothing — shows no circle at all, which at a glance is indistinguishable from Raiganj, which has no figure.
- Step 4
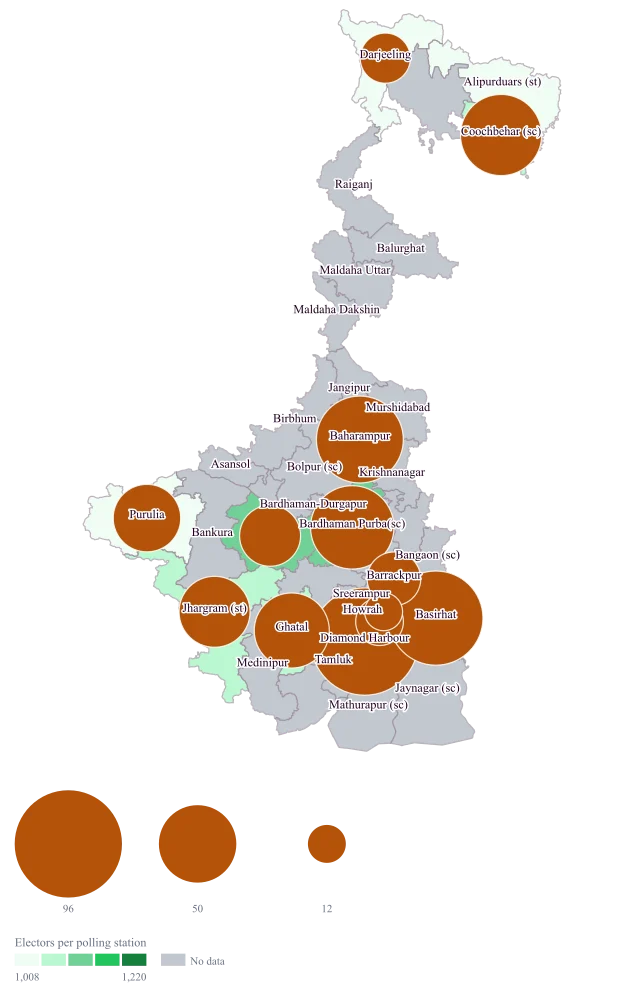
Give the bubbles a contrasting fill of #b45309, switch the area palette to green, turn on name labels, and title the legend "Electors per polling station".
The amber circles now sit clearly on top of the green ramp instead of dissolving into it, so the two encodings can finally be compared rather than merely coexist — Diamond Harbour's big circle on a middling fill and Kolkata Dakshin's small circle on the darkest fill are the chapter's finding, and they are legible in one pass. The name labels matter more here than on a district map, because a reader who has never seen a constituency map of West Bengal cannot place these shapes from memory.
The sheet
Paste these columns straight from Excel. The first column names the place; the rest are numbers. Nothing is uploaded — your sheet is read in the browser.
| Constituency | Polling stations added at the last revision | Electors per polling station |
|---|---|---|
| Jhargram (st) | 42 | 1010 |
| Bishnupur (sc) | 31 | 1084 |
| Bardhaman Purba(sc) | 58 | 1122 |
| Kolkata Uttar | 12 | 1246 |
| Kolkata Dakshin | 19 | 1290 |
| Barrackpur | 24 | 1218 |
| Diamond Harbour | 96 | 1174 |
| Basirhat | 74 | 1138 |
| Baharampur | 63 | 1096 |
| Ghatal | 47 | 1052 |
| Purulia | 38 | 1008 |
| Darjeeling | 21 | 964 |
| Coochbehar (sc) | 55 | 1026 |
| Alipurduars (st) | 0 | 938 |
| Raiganj | — | — |
Why this map
The chapter's question is whether the seats that got the most new stations are the seats whose stations were most crowded, and that is a comparison between two numbers inside one shape. The count goes on the bubble, where a circle twice the area honestly means twice as many; the crowding goes on the fill, because it is a rate and a rate may not be sized. Kolkata Dakshin's 1,290 electors per station is about 38 per cent above Alipurduars' 938, and Alipurduars added nothing at all — a pairing you can see in one shape and would have to hunt for across two columns. The bubble sits at the centre of the seat and marks nothing on the ground; this tool has no pins and no latitude and longitude, so no polling station can be plotted where it stands. All figures are invented illustrations and none is a real roll or a real revision.
What goes wrong
The geometry spells a reserved seat with its reservation in the name. West Bengal's seats include Jhargram (st), Bishnupur (sc), Coochbehar (sc), Alipurduars (st) and — with no space before the bracket — Bardhaman Purba(sc). Your sheet almost certainly says Jhargram. Run it through the matcher and a bare "Jhargram" scores about 0.73 against "Jhargram (st)", which is below the threshold for an automatic match and below the threshold for a suggestion, so it comes back as a review with nothing assigned. The seat is then simply not on the map, and twelve of the state's forty-two carry a suffix, so this is not a corner case.
Take the seat names from the map's own list and paste those, or add the suffix-free form as an alias once so every future sheet in the project resolves without a fight. Either way, read the review list rather than the matched count: a sheet of 42 rows that reports 30 matched has lost twelve seats, and on a fill map those twelve are grey, which looks like missing data rather than a spelling problem.
A seat is not a district, and this map will be read as though it were. Constituencies are drawn to hold roughly equal population within a state, so their areas are inversely related to how densely people live: Kolkata Uttar and Kolkata Dakshin cover a few square kilometres between them, Jhargram (st) and Alipurduars (st) cover a large part of the state's west and north, and all four hold comparable numbers of electors. The consequence is that the map's ink is spent almost entirely on the sparse seats, so whatever colour the rural end of the ramp takes will dominate the page regardless of how many people it describes.
Say so in the caption in one line, and never describe a colour as covering "most of the state" when what you mean is most of the state's area. If the chapter needs to talk about how many people sit in each band, put the elector totals in a table beside the map and quote from that. There is no cartogram here — the tool draws the seats at their true shape and cannot resize them to their electorates — so the table is doing work the map genuinely cannot.
Electors per polling station looks like one number and is really a choice of denominator, and the three plausible denominators give three different maps. Divide stations into the roll and you are measuring the queue a registered elector faces. Divide them into the resident population and you are measuring provision, which will look far worse in seats with many residents who are not on the roll. Divide them into households and you are measuring something closer to how far a family has to walk. Nothing on the map announces which one you picked, and a reader will assume whichever suits their argument.
Name the denominator in the legend title — "electors per station", not "people per station" — and fix it once across the whole sheet rather than letting one revision's figures come from the roll and another's from a projection. Keep the numerator and the denominator as their own columns beside the computed rate, so a figure that is queried can be taken apart. Alipurduars is a real 0 on the bubble column, meaning no station was added there, and it draws no circle at all; Raiganj is blank because that revision's return had not arrived, and it draws no circle either. Only the fill and the caption can tell those two apart.
Other worked examples
- Coverage vs Demand Map of India — Gujarat, district, bubble + colour
- District-Wise Sales Heat Map of India — Pan India, district, bubble + colour
- Health Facility Map of India by District — Tamil Nadu, district, bubble + colour
- School Enrolment Map of India by District — Bihar, district, bubble + colour