Maps by India Layer · free, in your browser
Editable India district map
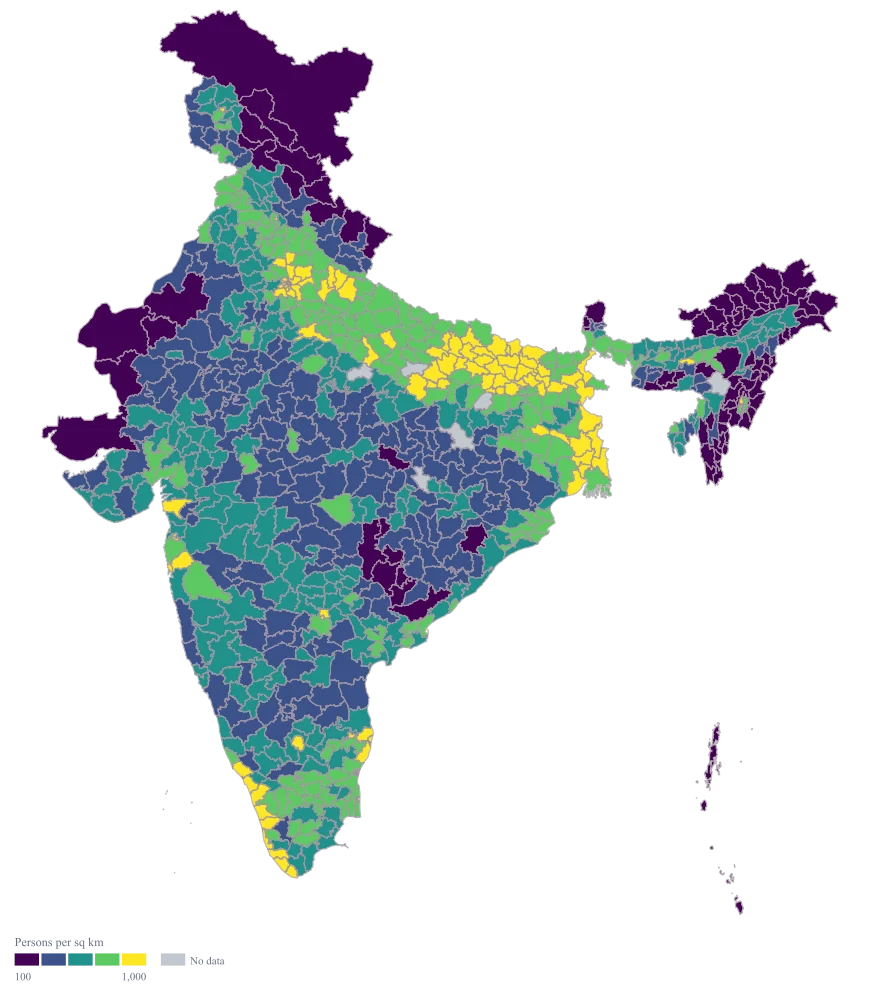
All 785 districts of India, coloured from your own spreadsheet. Export a vector SVG you can edit in PowerPoint, Illustrator or Figma, or a high-resolution PNG for a deck.
All 785 districts with their state and LGD code. Add a column of numbers and paste it back.
Why this is usually slow
Most “editable India maps” are a picture of the states. A district map needs 785 shapes, drawn from current boundaries, with names that match how your data spells them.
Colouring 785 shapes by hand in PowerPoint takes an afternoon and breaks the moment a number changes. Maps by India Layer colours them from the data, so a new number is a new paste, not a new drawing.
How it works
- Step 1
Choose Pan India, district level
Or one state: every state and union territory has its own district map.
- Step 2
Paste two columns from Excel
District names in the first, numbers in the second. Spellings like “Maldah” and “Malda”, or old names like Gurgaon, are matched for you.
- Step 3
Pick colours and labels
Sequential, diverging and colour-blind-safe palettes, custom breaks, value or name labels, a legend, a title and a source line.
- Step 4
Export
SVG keeps every district as its own editable shape. PNG comes at presentation resolution, with a transparent background if you want one.
Who uses it
Sales and strategy teams
District-wise sales, penetration or target achievement for a quarterly review.
Consultants
A market-sizing or coverage slide the client can trust, drawn from their own numbers.
NGOs and research teams
Programme reach, survey results or indicators by district, for a report or a funder deck.
Newsrooms
A district-level story map in minutes, with the source line built in.
Questions
How many districts are on the map?
785, the districts of India in the Local Government Directory (LGD) at the time the boundaries were last updated, each with its LGD code. Rows are matched to districts by name, including older spellings and former names.
Can I edit the map in PowerPoint?
Yes. Download SVG, insert it into PowerPoint and choose “Convert to shape”: every district becomes a shape you can recolour or move. A PNG is also available for decks where you only need the picture.
What if two districts have the same name?
Five names are shared by districts in two states, such as Aurangabad. Write the state after the name, “Aurangabad (Bihar)”, or the builder asks you which one you mean.
Ready when your sheet is
Free. No GIS software. Your data stays in your browser.