India Meteorological Department · 1 June to 26 September 2026
Monsoon 2026 rainfall by state
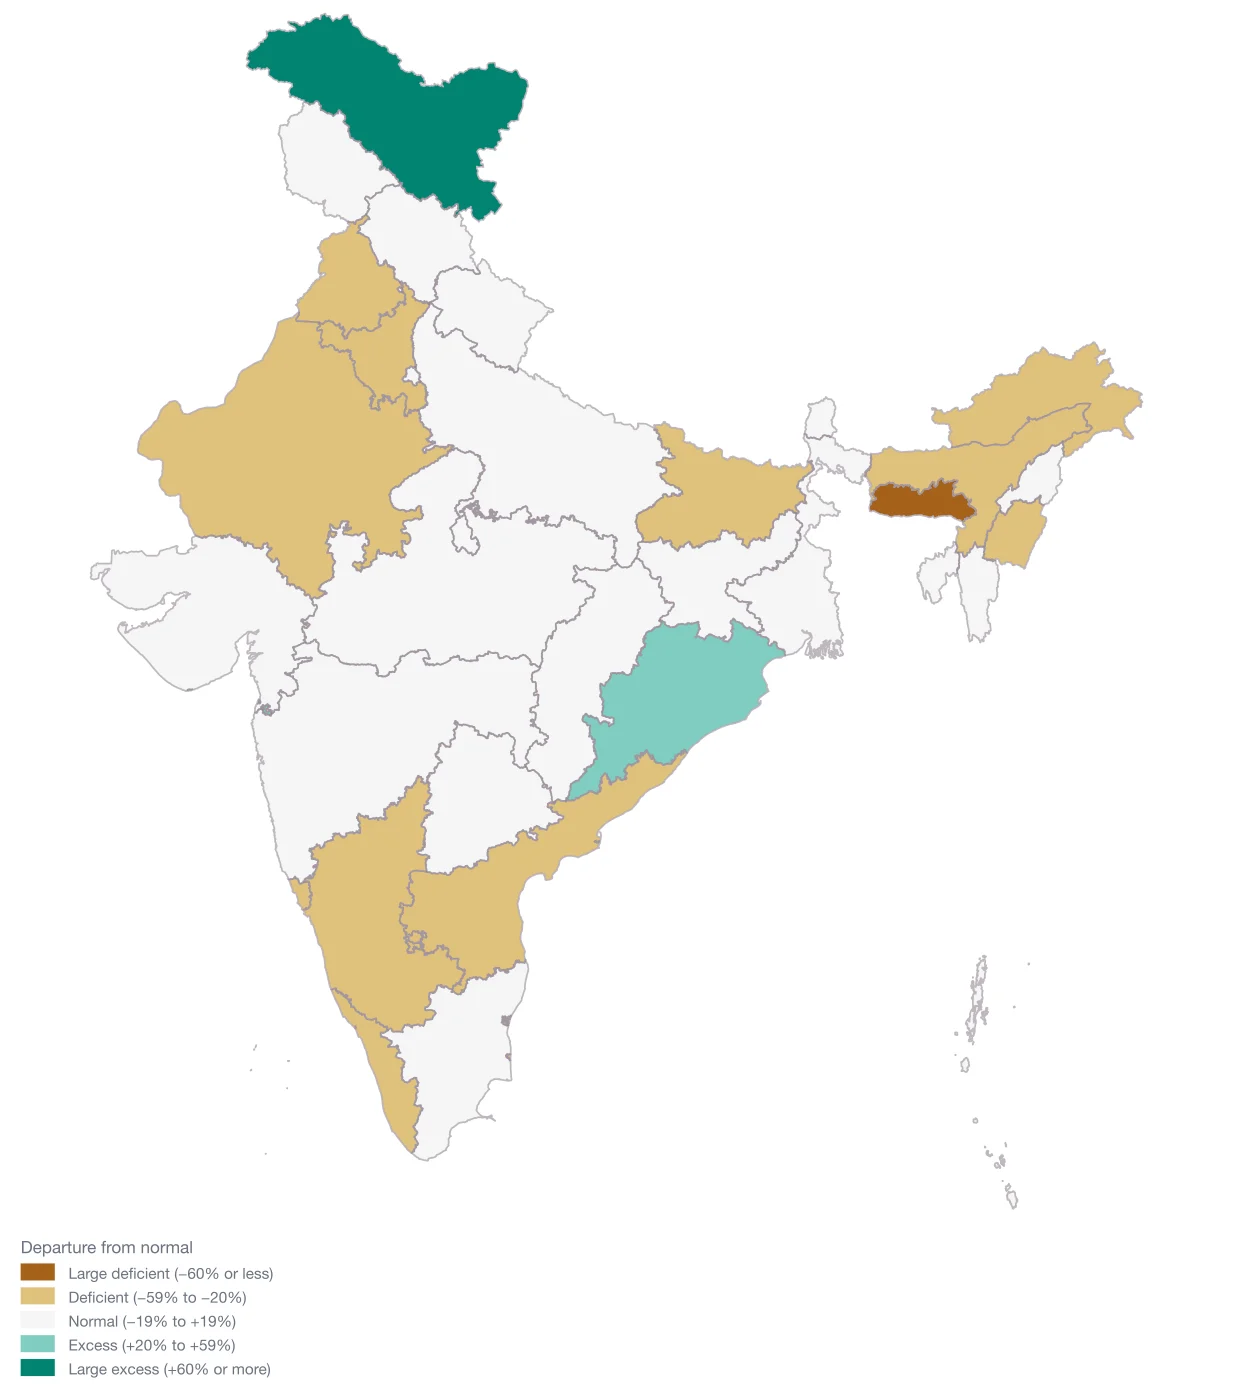
India received 749.2 mm of rain between 1 June and 26 September 2026, against a normal of 853.4 mm: -12%, which IMD still classes as normal. The shortfall is uneven. 14 of 36 states and union territories are deficient, 19 are normal and 3 are in excess.
Updated 27 September 2026 · Source: India Meteorological Department (IMD), Ministry of Earth Sciences
Key findings
- The driest are Meghalaya (-60%), Manipur (-44%), Arunachal Pradesh (-43%).
- The wettest, against their own normal, are Ladakh (+123%), Dadra & Nagar Haveli and Daman & Diu (+37%), Odisha (+31%).
- Much of the northeast is short: 4 of the 8 northeastern states are deficient or worse.
- Departure is measured against each state’s own long-period average, so a large percentage in a low-rainfall region can be a small number of millimetres. Compare the actual and normal columns.
Every state and union territory
| # | |||||
|---|---|---|---|---|---|
| 1 | Ladakh | 49.4 | 22.2 | +123% | Large Excess |
| 2 | Dadra & Nagar Haveli and Daman & Diu | 2,991.5 | 2,178.3 | +37% | Excess |
| 3 | Odisha | 1,477.6 | 1,130.7 | +31% | Excess |
| 4 | Sikkim | 1,825.8 | 1,641.7 | +11% | Normal |
| 5 | Andaman & Nicobar Islands | 1,743.9 | 1,573.4 | +11% | Normal |
| 6 | Nagaland | 1,090.7 | 1,018 | +7% | Normal |
| 7 | Chhattisgarh | 1,186.6 | 1,116.9 | +6% | Normal |
| 8 | Delhi | 562.7 | 541.3 | +4% | Normal |
| 9 | West Bengal | 1,352.5 | 1,311.7 | +3% | Normal |
| 10 | Uttar Pradesh | 754.7 | 738 | +2% | Normal |
| 11 | Uttarakhand | 1,174.5 | 1,154.7 | +2% | Normal |
| 12 | Jharkhand | 976.5 | 999.7 | -2% | Normal |
| 13 | Jammu & Kashmir | 526.9 | 545.2 | -3% | Normal |
| 14 | Madhya Pradesh | 902.9 | 940.4 | -4% | Normal |
| 15 | Gujarat | 638.5 | 701.4 | -9% | Normal |
| 16 | Himachal Pradesh | 637.4 | 729.5 | -13% | Normal |
| 17 | Tripura | 1,164.7 | 1,362.6 | -15% | Normal |
| 18 | Chandigarh | 715.4 | 844.7 | -15% | Normal |
| 19 | Telangana | 605.1 | 717.4 | -16% | Normal |
| 20 | Tamil Nadu | 256 | 309.2 | -17% | Normal |
| 21 | Maharashtra | 801.4 | 976.8 | -18% | Normal |
| 22 | Mizoram | 1,292.4 | 1,588 | -19% | Normal |
| 23 | Rajasthan | 335.6 | 432.8 | -22% | Deficient |
| 24 | Andhra Pradesh | 388.8 | 501 | -22% | Deficient |
| 25 | Haryana | 317.5 | 424.1 | -25% | Deficient |
| 26 | Assam | 1,055.1 | 1,450.5 | -27% | Deficient |
| 27 | Kerala | 1,451.6 | 1,985.4 | -27% | Deficient |
| 28 | Karnataka | 570.1 | 808.1 | -29% | Deficient |
| 29 | Lakshadweep | 720 | 1,010.1 | -29% | Deficient |
| 30 | Bihar | 655.6 | 968.8 | -32% | Deficient |
| 31 | Goa | 1,976.3 | 2,971.9 | -33% | Deficient |
| 32 | Puducherry | 251.3 | 394.8 | -36% | Deficient |
| 33 | Punjab | 255 | 436.4 | -42% | Deficient |
| 34 | Arunachal Pradesh | 931.3 | 1,640.6 | -43% | Deficient |
| 35 | Manipur | 565.2 | 1,016.6 | -44% | Deficient |
| 36 | Meghalaya | 1,070.4 | 2,645.5 | -60% | Large Deficient |
Method and source
- Cumulative southwest-monsoon rainfall from 1 June 2026, as published by IMD in its state-wise cumulative view. Figures are exactly as IMD prints them: millimetres to one decimal, departure as a whole percentage.
- Categories are IMD’s bands: large deficient −60% or less, deficient −59% to −20%, normal −19% to +19%, excess +20% to +59%, large excess +60% or more.
- IMD also lists a separate “Daman & Diu” row (−80%). It predates the 2020 merger into Dadra & Nagar Haveli and Daman & Diu, so it is left off the map.
- The season ends on 30 September. This page will be updated in place with the final figures.
India Meteorological Department (IMD), Ministry of Earth Sciences. 2026-06-01 to 2026-09-26 (cumulative, southwest monsoon season to date). Original source. Retrieved 27 September 2026.
Questions
Is the 2026 monsoon below normal?
As of 26 September 2026, India is -12% against its long-period average. IMD calls anything within ±19% normal, so the season is technically normal, but 14 states and UTs are in deficit.
Which state has received the least rain in the 2026 monsoon?
Meghalaya, at -60%: 1,070.4 mm against a normal of 2,645.5 mm.
Map your own state, district or PIN code data
Paste a column of places and a column of numbers from Excel, and Maps by India Layer draws a presentation-ready map of India — by state, district, PIN code or constituency.